Cardiovascular diseases (CVDs) are the leading cause of death globally, responsible for an estimated 17.9 million deaths each year—about 31% of all deaths worldwide.
The majority of CVD deaths result from heart attacks and strokes, with a significant portion occurring prematurely in individuals under 70 years old.
Heart failure, a frequent consequence of CVDs, can be predicted using clinical and demographic features. This project leverages a dataset containing 11 relevant features to analyze and predict heart disease risk.
By applying data analysis and machine learning techniques, the goal is to support early detection and management of cardiovascular risk, especially for individuals with risk factors such as hypertension, diabetes, or hyperlipidaemia.
The resulting insights and predictive models can assist healthcare professionals in making informed decisions and improving patient outcomes.
This dataset was curated by merging five previously independent heart disease datasets, unified by 11 shared features.
As a result, it represents the largest heart disease dataset currently available for research.
Oldpeak: ST depression induced by exercise relative to rest [Numeric value]
ST_Slope: The slope of the peak exercise ST segment [Up: upsloping, Flat: flat, Down: downsloping]
HeartDisease: Output class [1: heart disease, 0: Normal]
Data Cleaning
Before analysis, the dataset underwent a thorough data cleaning process to ensure accuracy and reliability. The following steps were performed:
Duplicate Removal: Checked for duplicate records to avoid bias and redundancy.
Missing Values: Checked for missing or null values across all features. Any incomplete records were either imputed using appropriate statistical methods or excluded if imputation was not feasible.
Data Type Consistency: Ensured all features had consistent and appropriate data types (e.g., numeric, categorical).
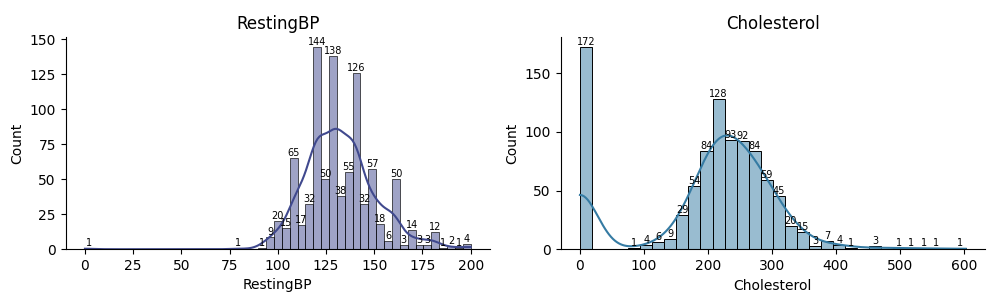
Outlier Detection: Detected and reviewed outliers in features such as RestingBP, Cholesterol, and MaxHR. Outliers were addressed based on domain knowledge and statistical thresholds.
Feature Encoding: Categorical features were encoded into numerical values to facilitate analysis.
As shown above, both RestingBP and Cholesterol had some 0 values, which are not physiologically plausible.
These were treated as missing values and replaced with the median values for the respective fields. A binary indicator was also created to flag these records for further analysis.
Data Analysis
The cleaned dataset contains 918 observations and 12 features. Below is a summary of the dataset and key descriptive statistics:
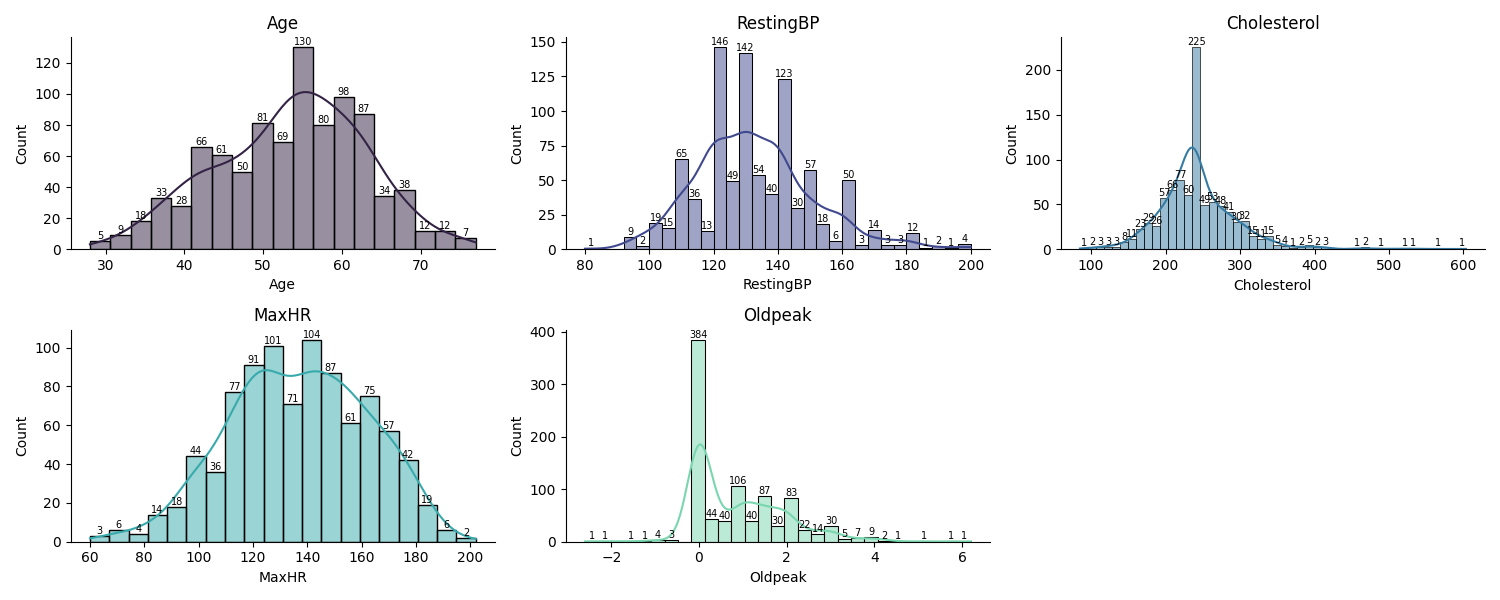
Average patient age is approximately 54 years, with a range from 28 to 77.
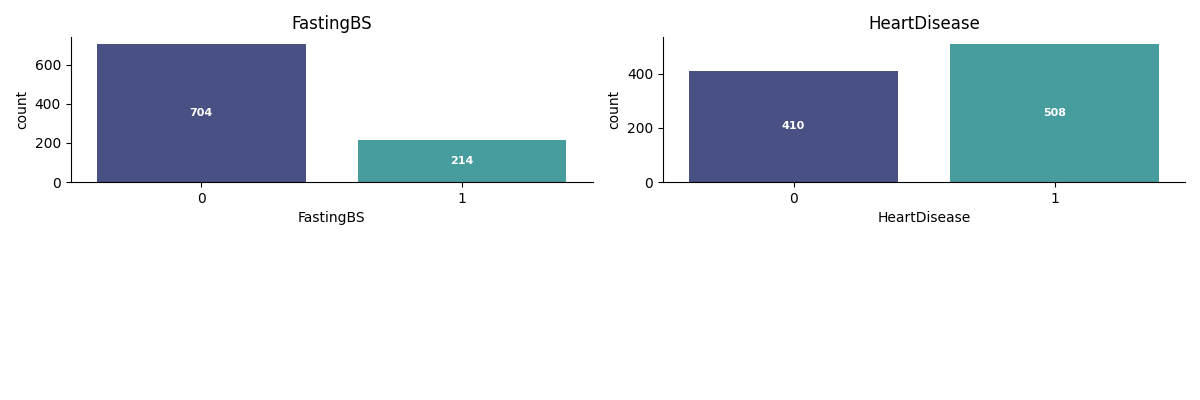
About 55% of patients in the dataset have heart disease.
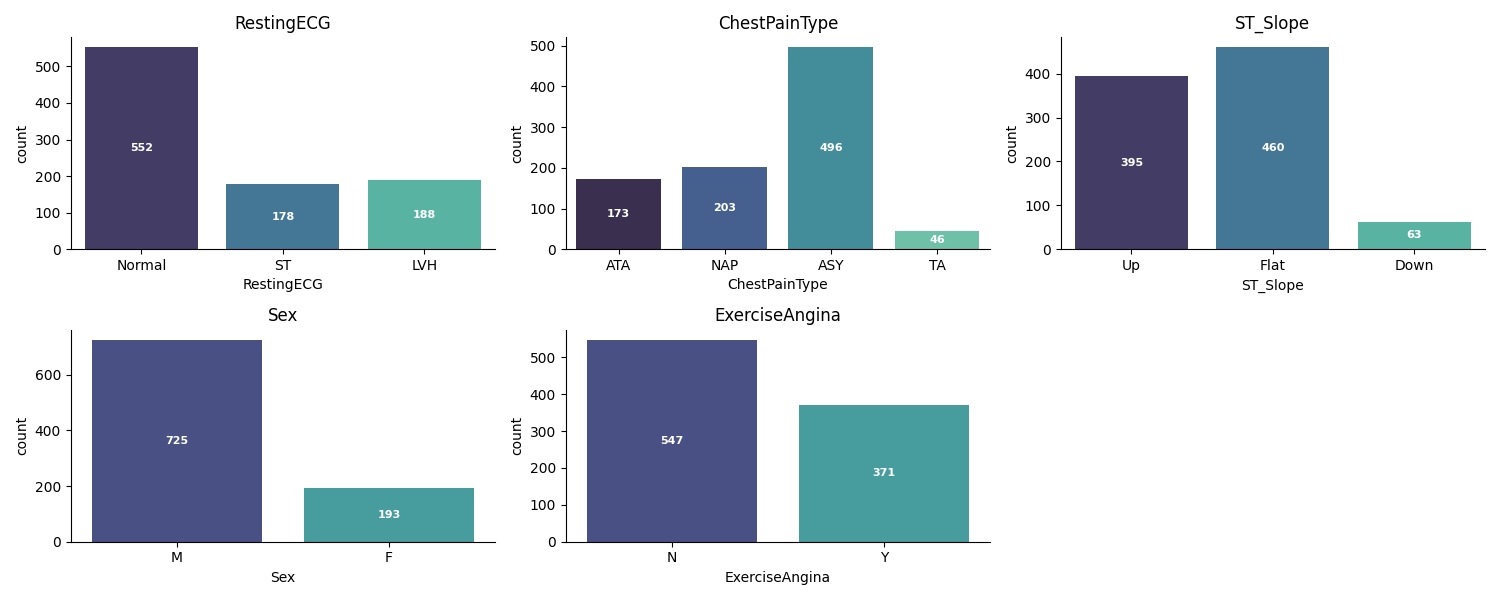
Most patients are male (725 out of 918).
The most common chest pain type is asymptomatic (ASY).
Resting blood pressure and cholesterol values show significant variability, with some outliers present.
Data Visualization
Visualizations can provide valuable insights into the dataset. Below are some examples of visualizations that can be created:
Numeric Features: Histograms of Age, RestingBP, Cholesterol, MaxHR, and Oldpeak to show their distributions.
Binary Features: Bar charts for FastingBS and HeartDisease to display counts of each category.
Categorical Features: Bar charts for RestingECG, Sex, ST_Slope, ChestPainType, and ExerciseAngina to visualize the frequency of each category.
Correlation Matrix Heatmap: Heatmap to show correlations between numeric features and the target variable (HeartDisease).
Machine Learning Model
This project uses a Random Forest classifier to predict heart disease based on the dataset features.
Random Forest is an ensemble method that builds multiple decision trees and combines their outputs for improved accuracy and robustness.
The performance of these models can be evaluated using metrics such as accuracy, precision, recall, and F1-score. Cross-validation can then be used to ensure the model's robustness and generalizability.
Feature importance analysis can help identify the most significant predictors of heart disease.
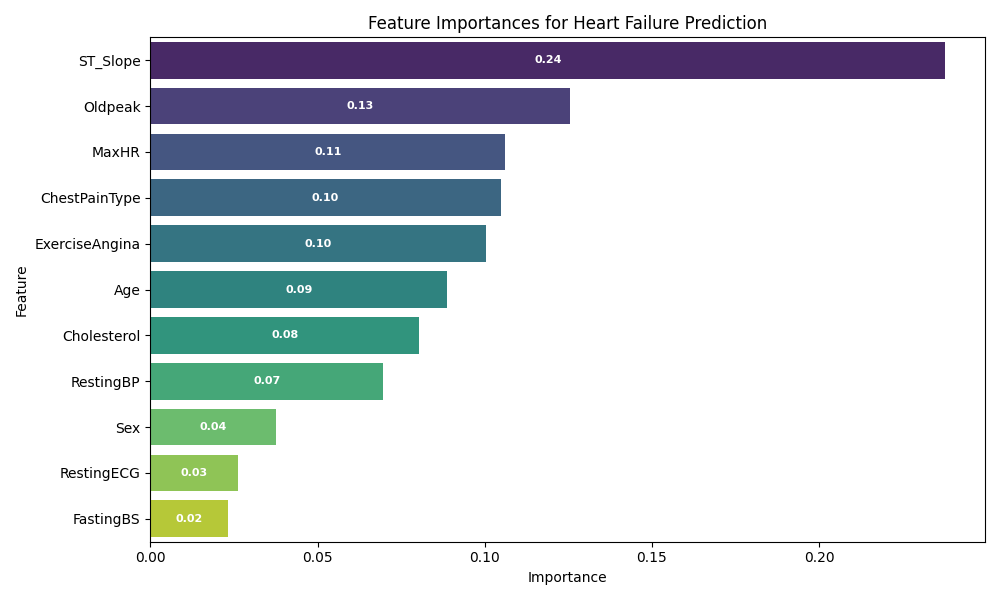
Feature Importance Visualization
The plot below shows the relative importance of each feature in predicting heart disease using the Random Forest classifier:
ST_Slope, Oldpeak, and MaxHR are the most influential features.
ChestPainType, ExerciseAngina, and Age also contribute significantly to the model's predictions.
Other features such as Sex and FastingBS have lower importance.
Conclusion
This project demonstrates the potential of data analysis and machine learning in predicting heart disease risk.
By leveraging a comprehensive dataset and applying appropriate techniques, we can gain valuable insights into the factors contributing to cardiovascular diseases.
The Random Forest classifier provides a robust model for predicting heart disease, with feature importance analysis highlighting key predictors.
These findings can assist healthcare professionals in identifying at-risk patients and implementing preventive measures.
Future work could involve exploring additional machine learning algorithms, hyperparameter tuning, and incorporating more diverse datasets to enhance model performance and generalizability.
Overall, this project underscores the importance of data-driven approaches in healthcare and the potential for improving patient outcomes through early detection.